
The Cause and Effect: How to Diagnose SEO Problems
And how to find the right things


Hello Riddlers!
📌 📌 Set me as a preferred source on Google! Click here.
Warm Up
Around this same time last year I talked about diagnosing SEO traffic drops, I had a simple framework:
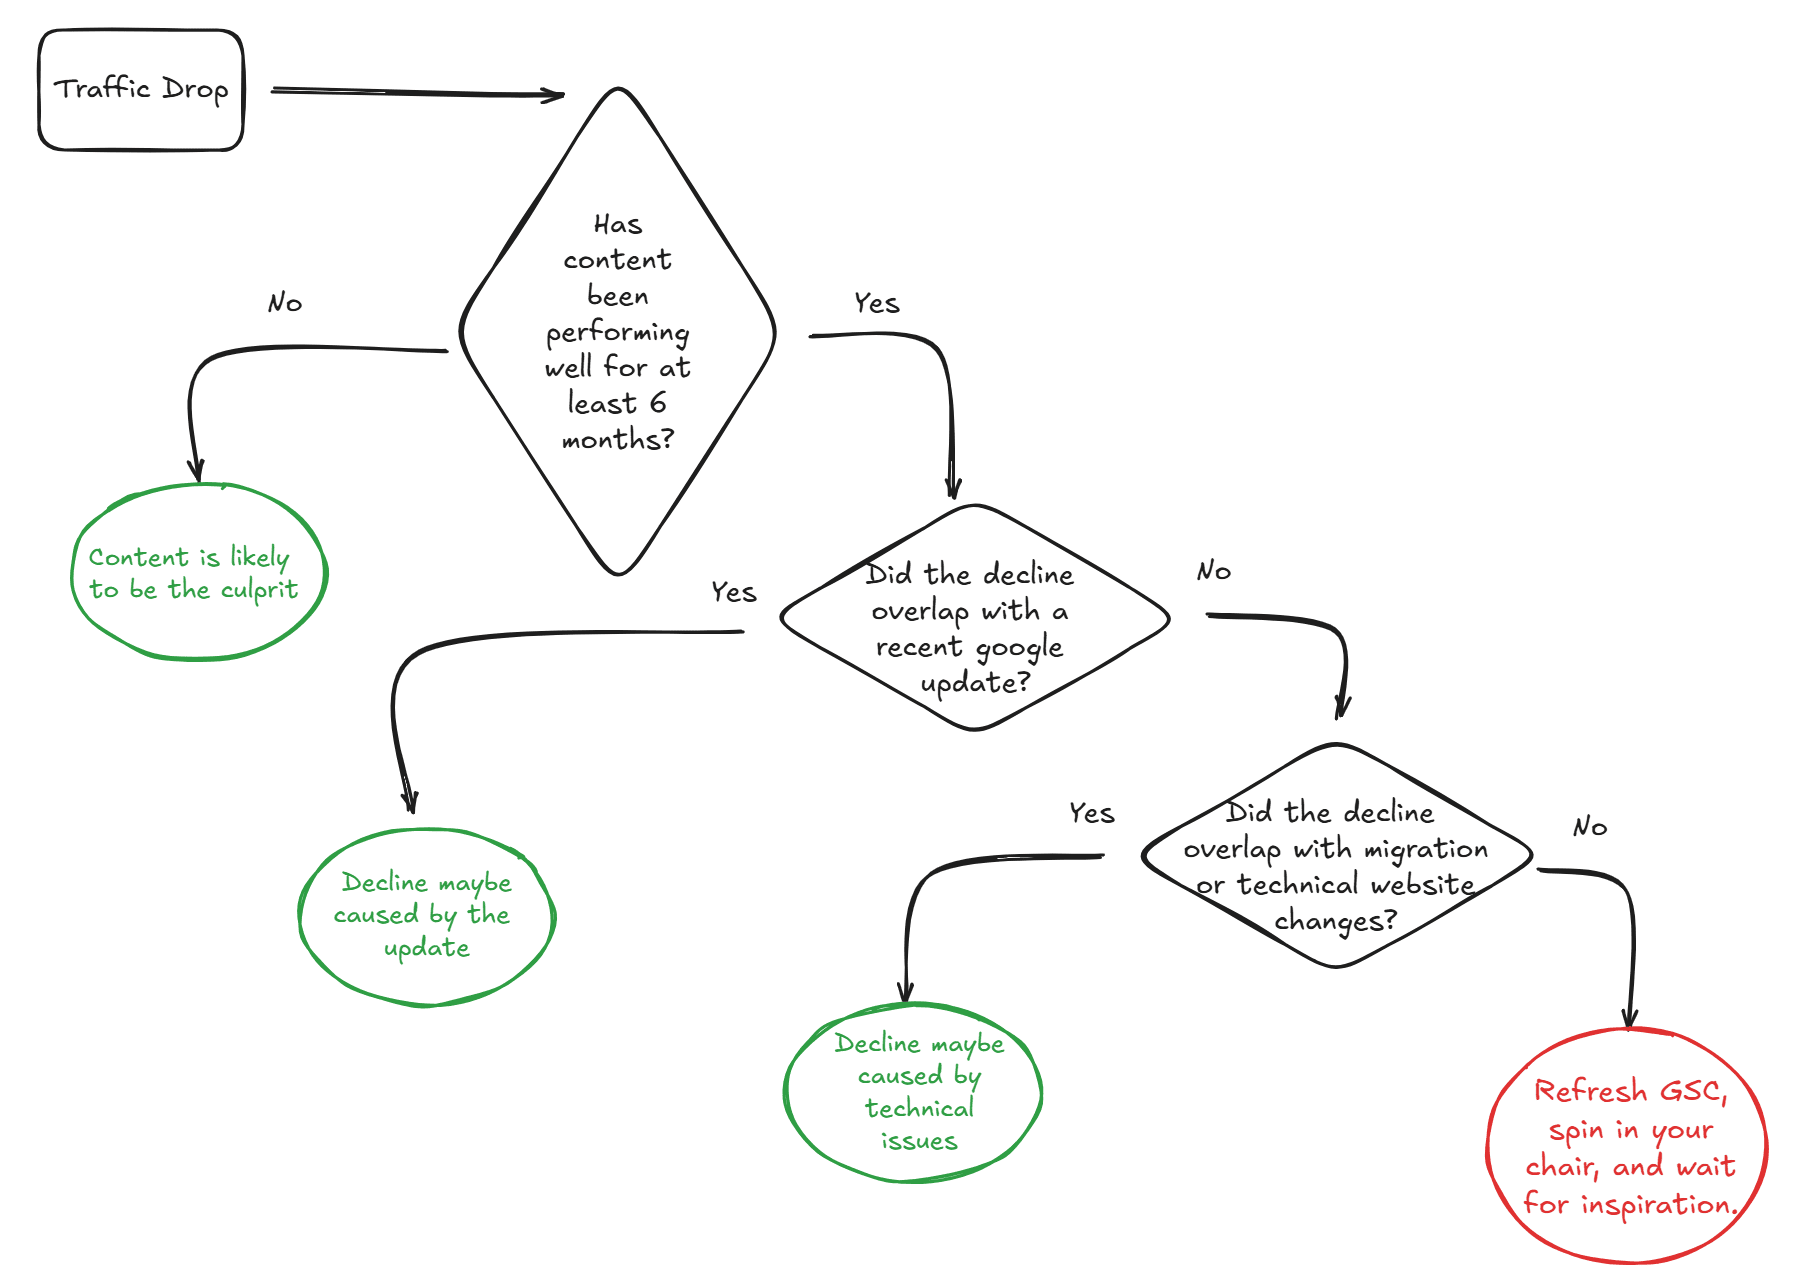
Since then, my SEO learning has continued — and today I want to share a technique that can diagnose any SEO issue.
It’s called the Ishikawa diagram (aka the Fishbone diagram): a visual root-cause analysis tool that connects cause and effect to uncover why an SEO problem is happening, and what you can actually test to fix it.
What I love about this technique is that it structures your thinking into a diagram you can share with your team and stakeholders.
So buckle up!
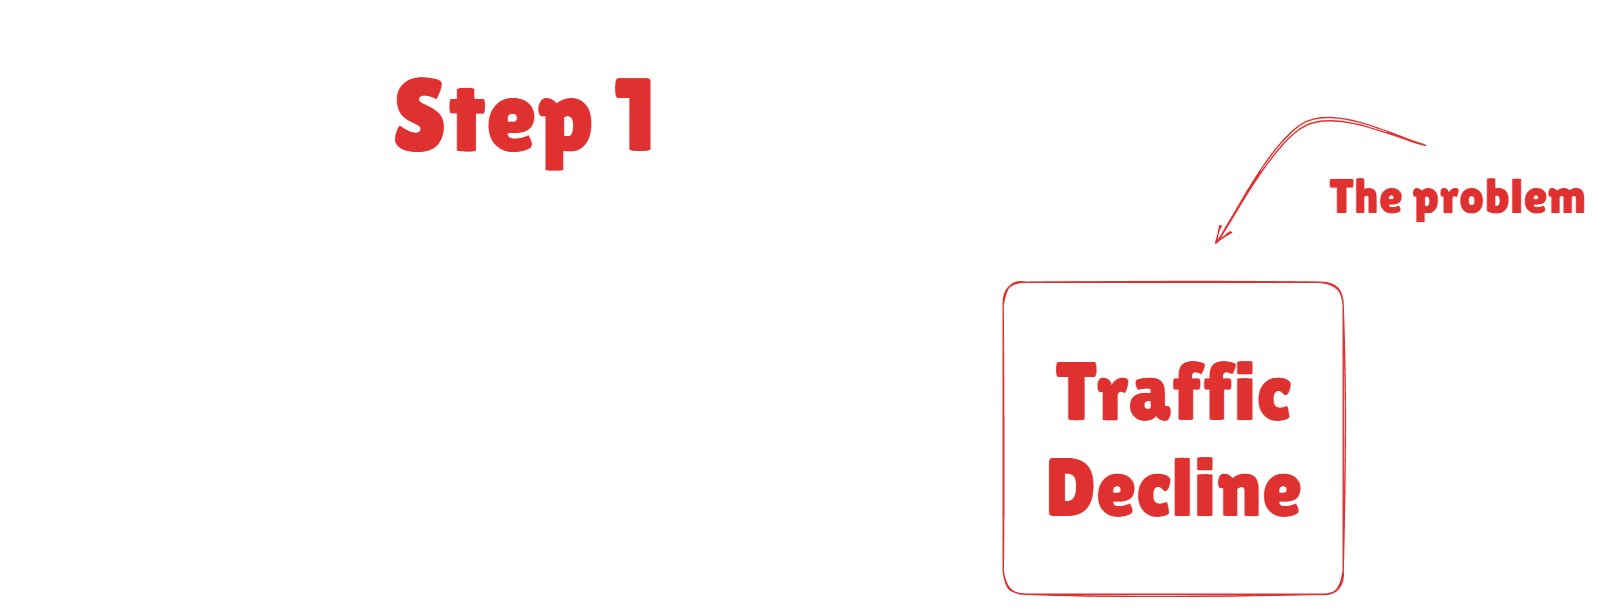
1# Start with the effect
Just draw a simple box (or whatever shape really) and write the problem or the symptom you’re seeing that you wish to address.
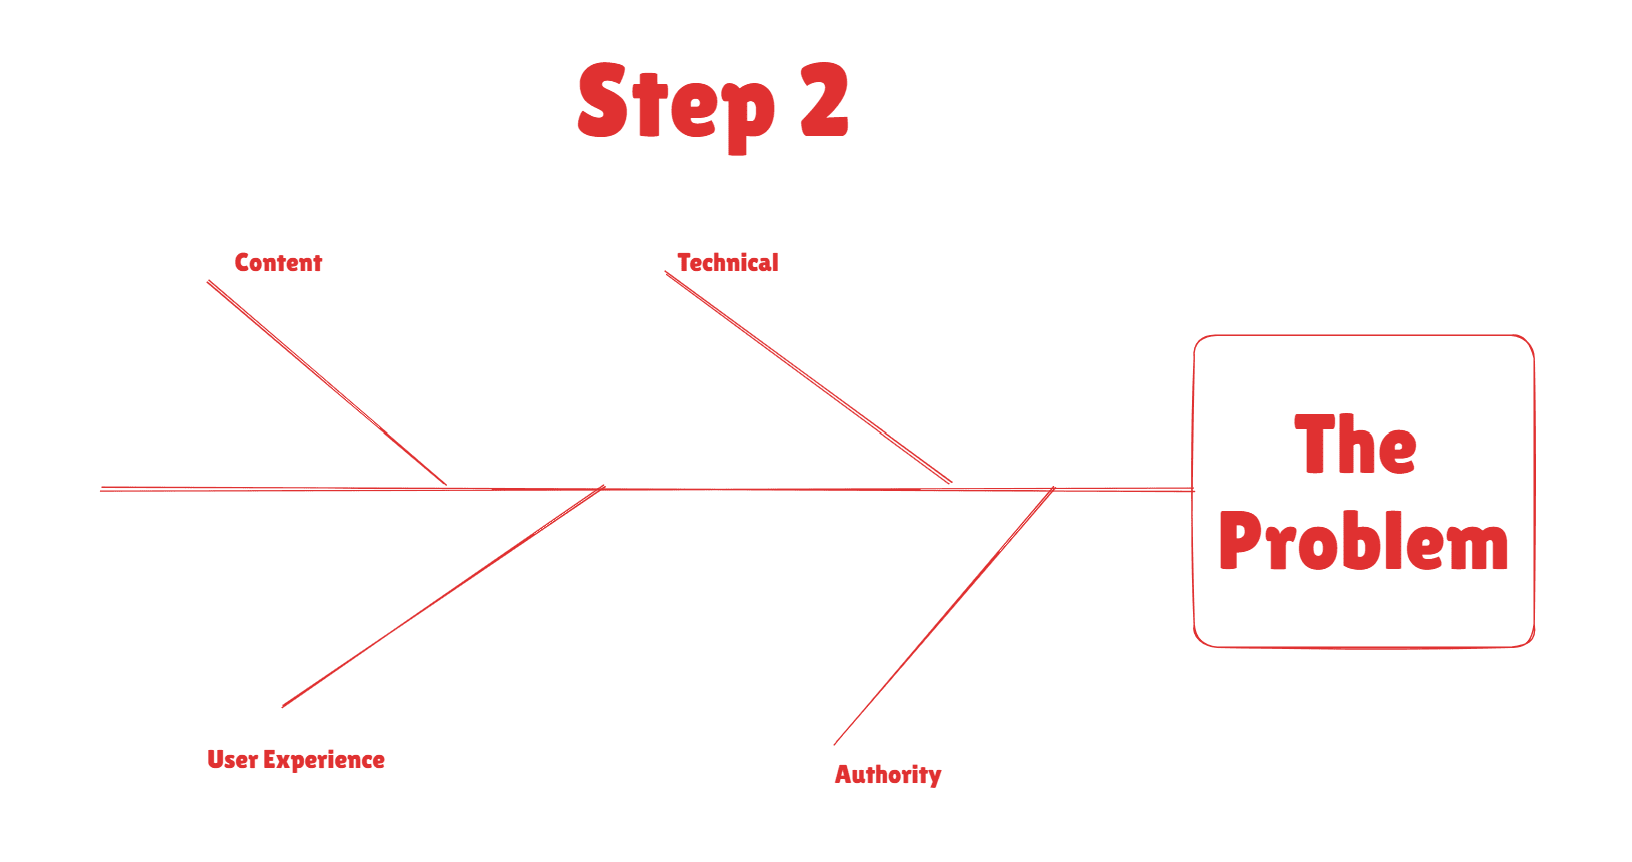
2# Buckets of causes
The next step would be to draw a diagonal line, and list all category of potential causes. We’re not listing exact causes yet, just categories of potential causes.
In SEO we have a handful of established categories, so our work is pretty clear:
Technical
Content
Authority
User experience
You may want to add more categories like market changes or Google updates and SERPs changes… totally up to you how you tackle this.
It’s fascinating how we can all work from similar-ish checklists yet arrive at completely different SEO results and performance in search.
I really think this is very helpful in breaking down a complex problem, and help to focus on it from various perspectives.
Reminds me of the 6 thinking hats technique, where you wear a different hat for a different mode of thinking all in an attempt to solve a problem.
This is pretty much similar, only here, instead of hats, you’re switching between a technical lens, a content lens, and so on.
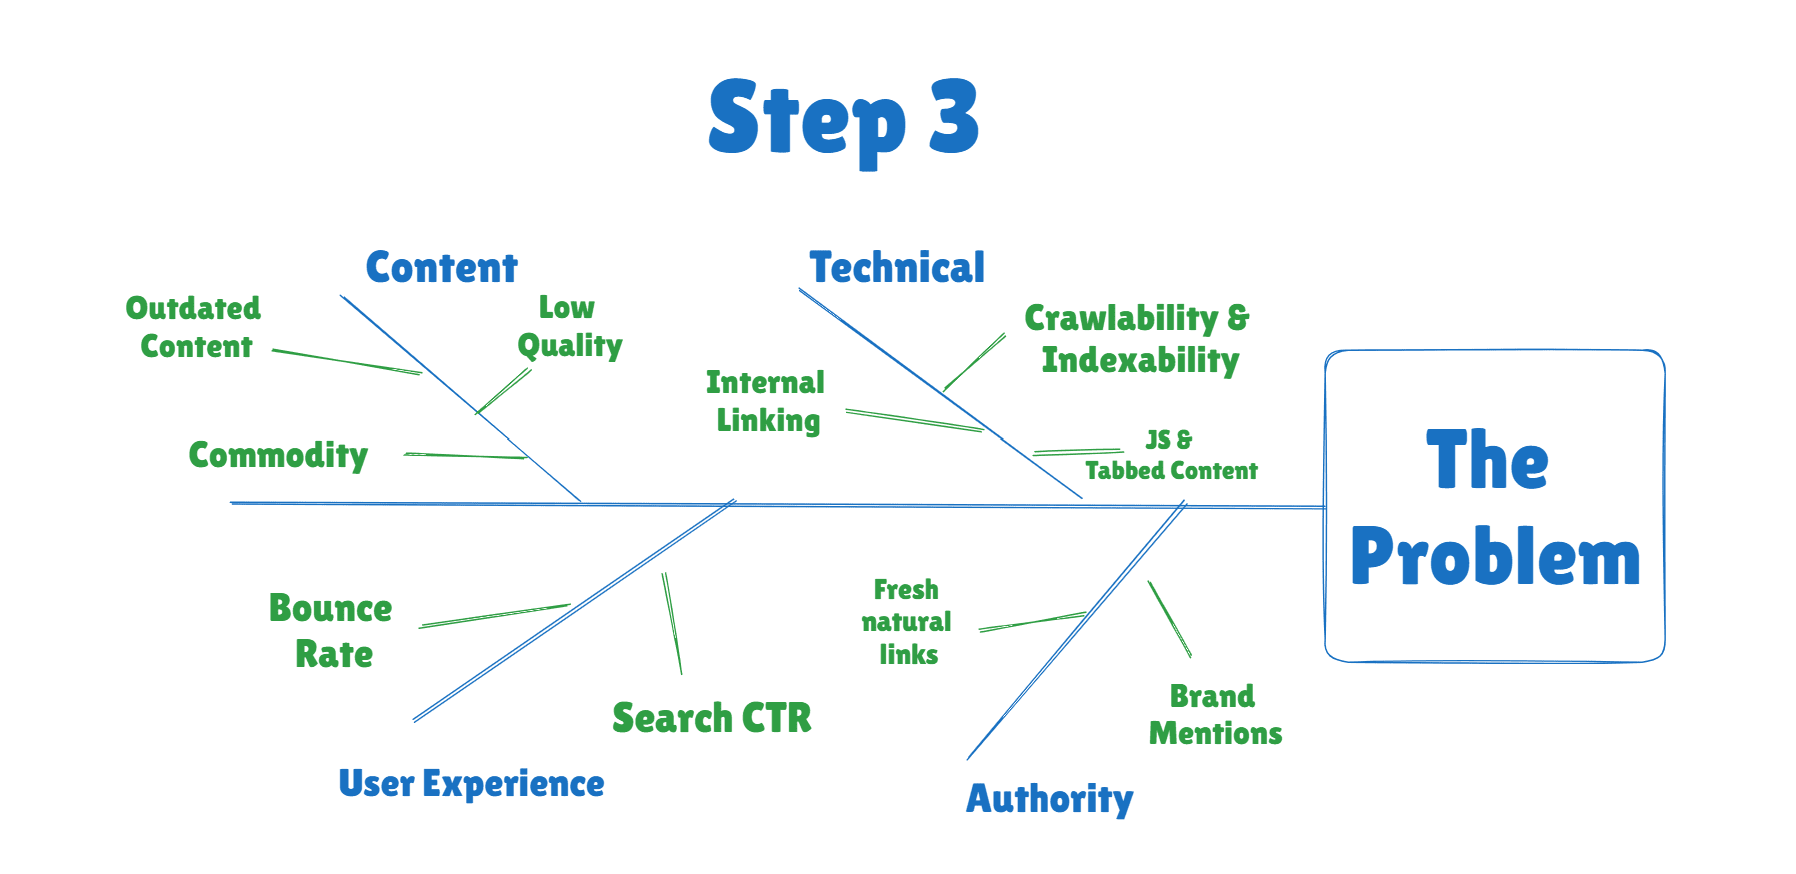
3# Potential Causes
Now it’s time to fill in potential causes under each of the above buckets (and yes I changed the diagram color 😄)
A quick disclaimer: this is not meant to be an SEO checklist. It's simply an example of how one person might approach the problem. Your own experience, knowledge of the website, and understanding of the industry may lead you to a completely different diagram.
Here’s how I thought about this from each lens:
Technical lens: from my experience, sometimes things happen on the website itself that can cause a decline in traffic. Did your tech team remove the sitemap and not tell you, is there a UX change that included a lot of JS, is server returning 5XX errors or your internal links for one reason or the other have changed?
Content lens: if your content is low quality (AI and spammy for example) it will stop working at some point, that if it worked at all. So that maybe the issue, or is your content old and have not been updated in a long while? your competitors are working btw, they don’t stop, and so shouldn’t you, SEO is not a one and done thing so it maybe your content is up for a refresh. Finally, is your content a “commodity” type of content that is just lame, expected, and has no unique angle?
Authority lens: for so long in SEO pure brand mentions meant nothing, but that has changed, did your strategy for building authority adapt? Also let’s say you did a domain migration, and all your backlinks are pointing to your old domain (ya ya I know you created redirects and all), but wouldn’t it be nice to get a fresh pack of backlinks pointing to your new domain?
User Experience: a lot of SEOs would not bucket this alone, but I would 😄 mainly because it requires extensive type of work and analysis on it’s own. How’s the bounce rate on your page? while this specific metric is NOT a ranking factor, it can also indicate that there’s a problem with your content. How is your CTR? well I know that CTR is dead in search according to some ppl 😄 but it’s always worth a look to understand if there’s anything you can do to improve this (test different title formats perhaps?)
So basically keep asking why, and filling in the diagram until you’ve reached a useful level of detail. That is when the cause is specific enough to be able to test a change and measure it’s effect.
and you’re done! You now have a clear view of potential causes, that you can prioritize and start testing out.
And That’s a Wrap (Almost 😄)
It’s not uncommon for the most powerful ideas to be surprisingly simple.
There’s a quote often attributed to Albert Einstein: “If you can’t explain it simply, you don’t understand it well enough.” Whether or not he actually said it, the principle holds true.
What I appreciate most about the Ishikawa diagram is its simplicity. It helps organize messy problems into something visual, collaborative, and actionable.
And if you struggle to populate the diagram at all, that can be useful information too, it may simply highlight areas where you need to deepen your SEO knowledge and experience.
That’s that for today folks and see you in the next newsletter!
Sources Worth Checking
Support the Riddler!
Sign up for my newsletter if you’re not already.
Share the newsletter and invite your friends to signup. Help me reach 2k signups by end of 2025 please 🙂
Provide feedback on how I can make this newsletter better!!!
If you’re an SEO tool or an SEO service provider, consider sponsoring my newsletter. I’m also open to other partnership ideas as well.
Disclaimer: LLMs were used to assist in wording and phrasing this blog.